Performance evaluation across 72 factorial configurations (1,440 rounds, seeds 1000..1019), held-out fraud mode evaluation (seeds 2000..2019), and detection-by-day analysis (seeds 3000..3019).
- Risk ranking vs deterministic rules: +0.131 [+0.119, +0.142] precision@4 advantage (+0.195 [+0.178, +0.211] average precision).
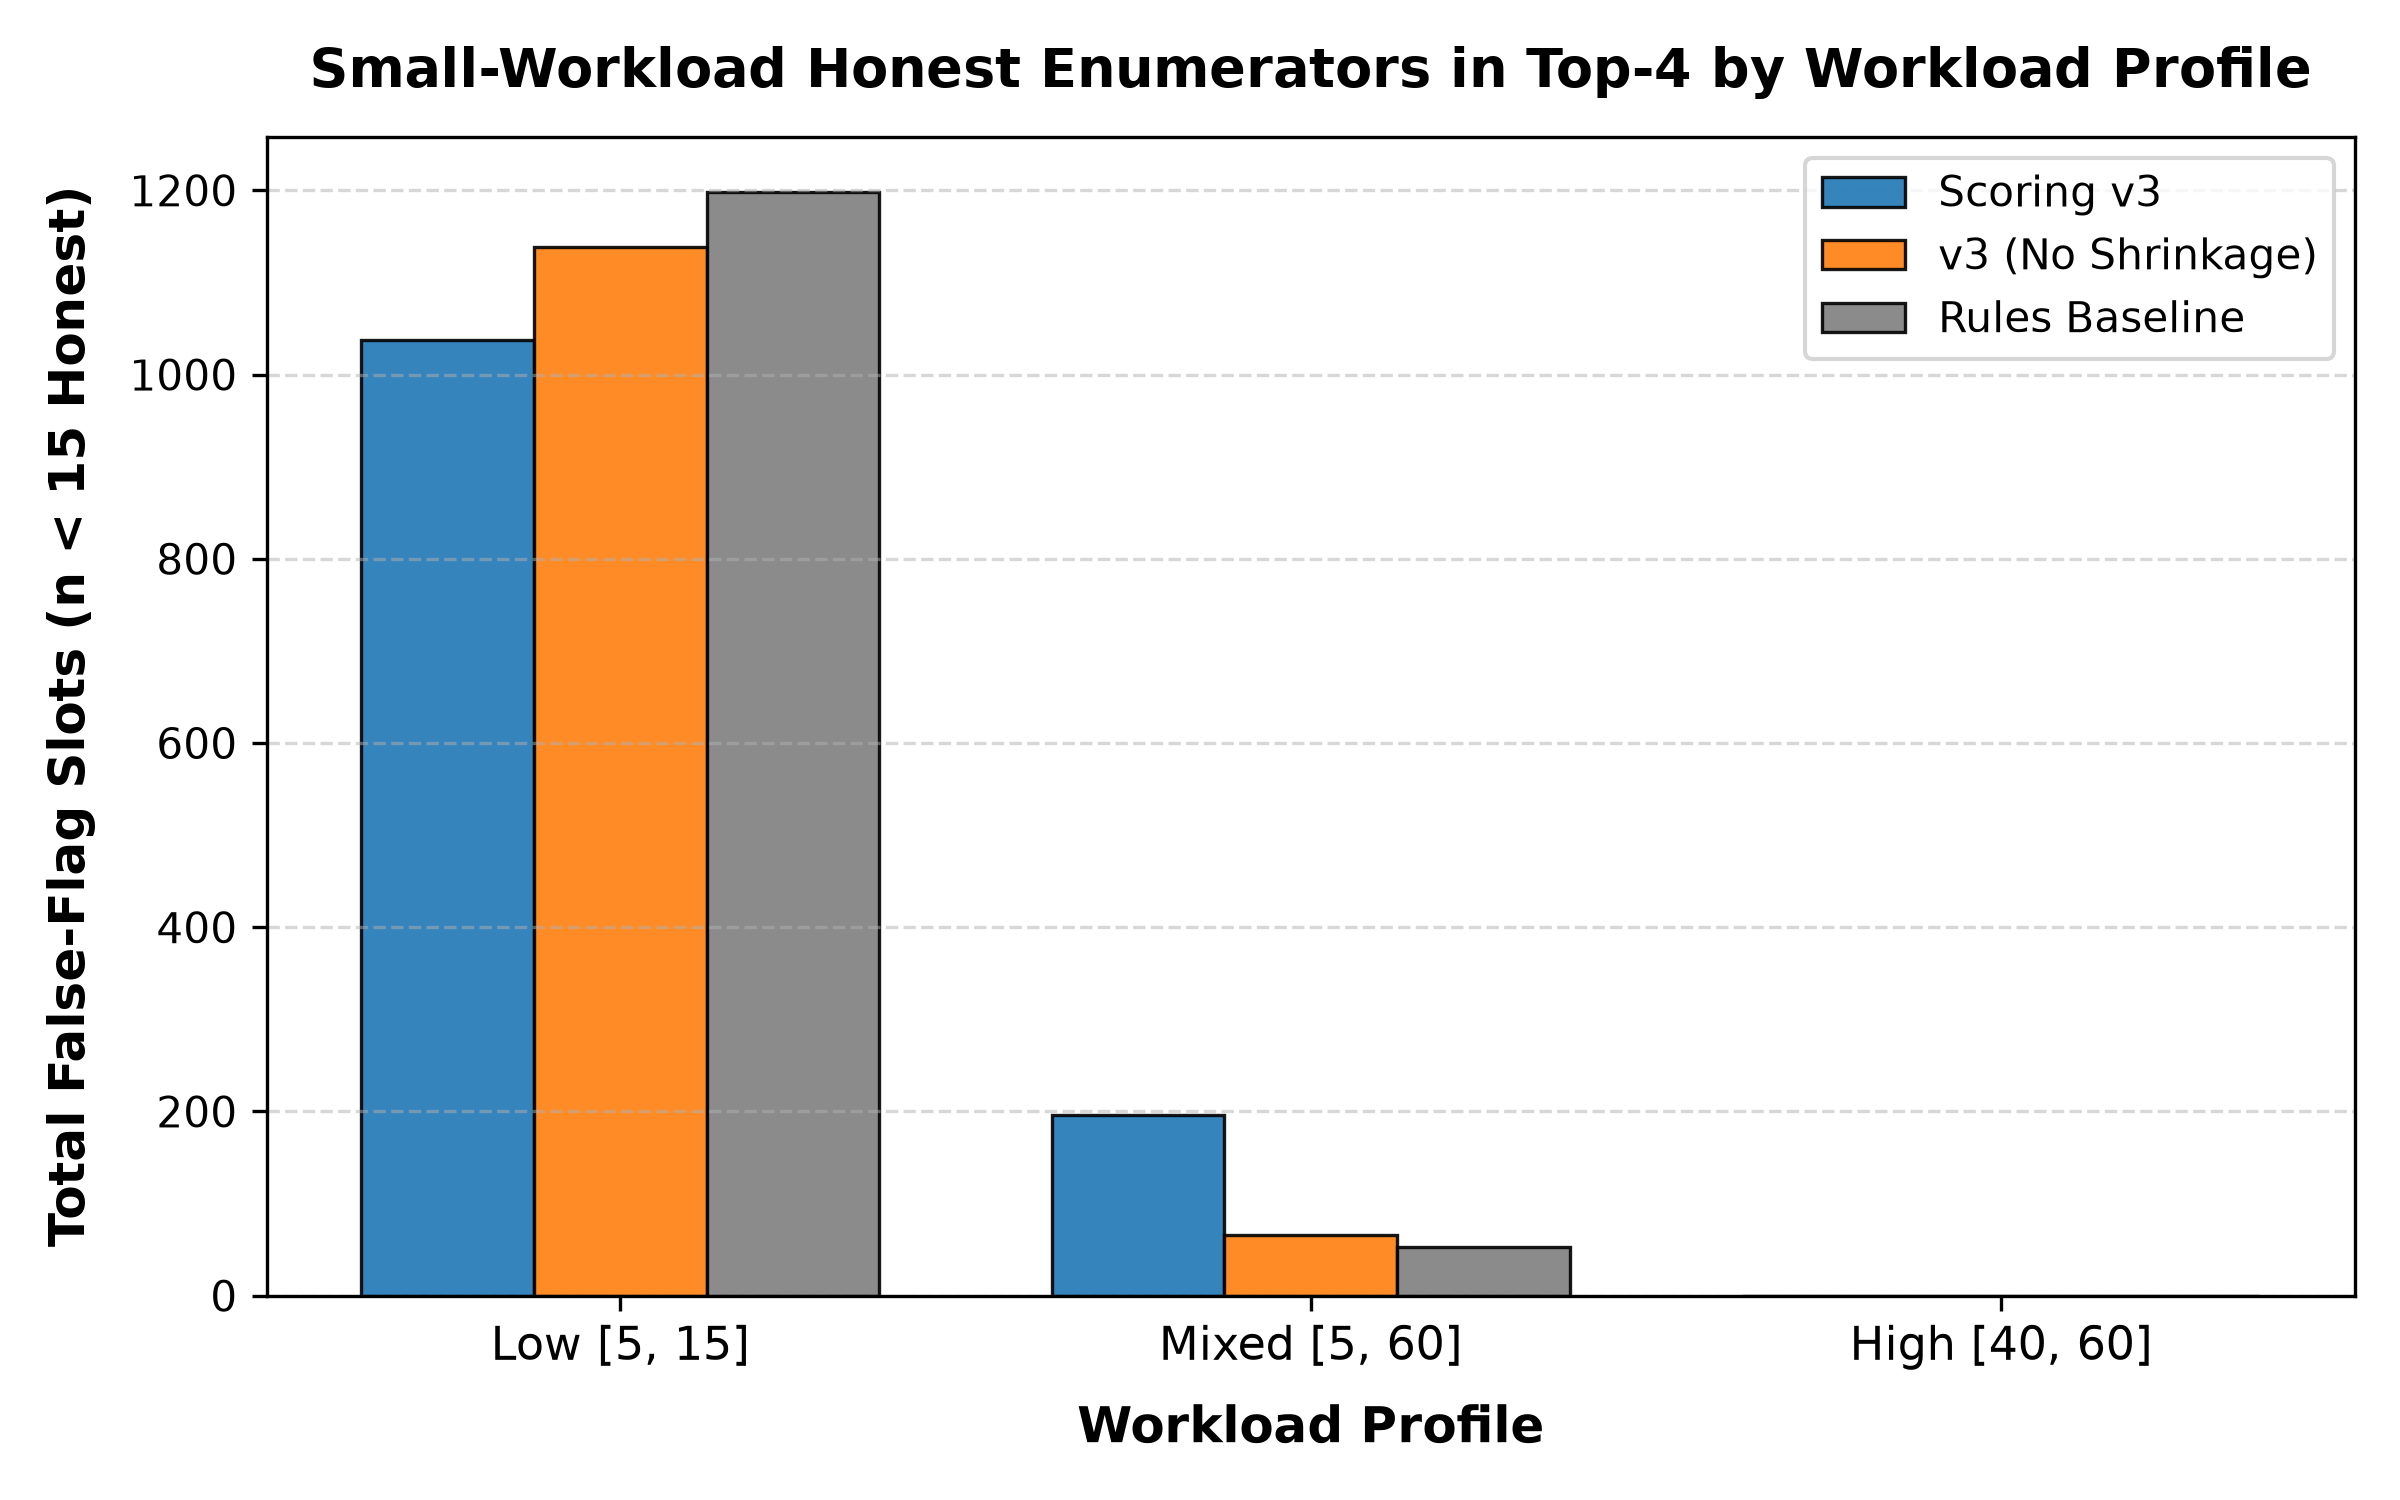
- Shrinkage depends on workload: low workload +0.069 [+0.052, +0.087]; in mixed workloads it shifts false flags onto small-sample honest enumerators (196 vs 66 of 1,920 top-4 slots).
- Rules beat ranking on rushed: 0.63 vs 0.35 recall@4 (0.627 vs 0.347).
- Calibrated FDR control not achieved: uncalibrated empirical null led to frozen risk ranking approach.
Rule engine scale benchmark (1M rows): all 12 rules, median 1,712 ms over 3 runs (1,760 / 1,712 / 1,677 ms); single-threaded DuckDB-Wasm; Windows, 16 logical CPUs, Chromium 152; parity with the Python engine 12/12 rules in both scenarios.
Full table
| Workload |
Prevalence |
Max Achievable |
Scoring v3 (Mean) |
v3 Rel. Prec. |
v3 10th–90th |
No-Shrink (Mean) |
No-Shrink Rel. |
Rules (Mean) |
Rules Rel. |
| Low [5, 15] |
0.02 |
0.25 |
0.0979 |
0.3917 |
[0.00, 0.25] |
0.0979 |
0.3917 |
0.0625 |
0.2500 |
| Low [5, 15] |
0.05 |
0.50 |
0.2854 |
0.5708 |
[0.00, 0.50] |
0.2812 |
0.5625 |
0.1417 |
0.2833 |
| Low [5, 15] |
0.10 |
1.00 |
0.4938 |
0.4938 |
[0.25, 0.75] |
0.3792 |
0.3792 |
0.3563 |
0.3563 |
| Low [5, 15] |
0.20 |
1.00 |
0.7042 |
0.7042 |
[0.25, 1.00] |
0.5458 |
0.5458 |
0.6125 |
0.6125 |
| Mixed [5, 60] |
0.02 |
0.25 |
0.1375 |
0.5500 |
[0.00, 0.25] |
0.1500 |
0.6000 |
0.0625 |
0.2500 |
| Mixed [5, 60] |
0.05 |
0.50 |
0.2750 |
0.5500 |
[0.00, 0.50] |
0.2771 |
0.5542 |
0.1479 |
0.2958 |
| Mixed [5, 60] |
0.10 |
1.00 |
0.4688 |
0.4688 |
[0.25, 0.75] |
0.5167 |
0.5167 |
0.3375 |
0.3375 |
| Mixed [5, 60] |
0.20 |
1.00 |
0.7729 |
0.7729 |
[0.50, 1.00] |
0.7333 |
0.7333 |
0.5875 |
0.5875 |
| High [40, 60] |
0.02 |
0.25 |
0.1521 |
0.6083 |
[0.00, 0.25] |
0.1500 |
0.6000 |
0.0479 |
0.1917 |
| High [40, 60] |
0.05 |
0.50 |
0.2792 |
0.5583 |
[0.00, 0.50] |
0.2875 |
0.5750 |
0.1875 |
0.3750 |
| High [40, 60] |
0.10 |
1.00 |
0.5229 |
0.5229 |
[0.25, 0.75] |
0.5729 |
0.5729 |
0.2812 |
0.2812 |
| High [40, 60] |
0.20 |
1.00 |
0.8021 |
0.8021 |
[0.50, 1.00] |
0.7750 |
0.7750 |
0.5979 |
0.5979 |
Full table
| Mode |
Type |
Rounds |
Scoring v3 (x/n [95% CI]) |
No-Shrinkage (x/n [95% CI]) |
Rules Baseline (x/n [95% CI]) |
| copy_paste |
Standard Active |
756 |
950/990 (0.9596) [0.9454, 0.9702] |
741/990 (0.7485) [0.7205, 0.7745] |
817/990 (0.8253) [0.8004, 0.8476] |
| straight_lining |
Standard Active |
900 |
411/1116 (0.3683) [0.3405, 0.3970] |
630/1116 (0.5645) [0.5353, 0.5933] |
85/1116 (0.0762) [0.0620, 0.0932] |
| rushed |
Standard Active |
846 |
343/990 (0.3465) [0.3175, 0.3766] |
359/990 (0.3626) [0.3333, 0.3931] |
621/990 (0.6273) [0.5967, 0.6568] |
| invented_gps |
Standard Active |
846 |
561/1026 (0.5468) [0.5162, 0.5770] |
498/1026 (0.4854) [0.4549, 0.5160] |
72/1026 (0.0702) [0.0561, 0.0875] |
| too_average |
Standard Active |
972 |
131/1278 (0.1025) [0.0870, 0.1203] |
60/1278 (0.0469) [0.0366, 0.0600] |
48/1278 (0.0376) [0.0284, 0.0494] |
| partial_section |
Held-Out (OOD) |
15 |
11/15 (0.7333) [0.4805, 0.8910] |
7/15 (0.4667) [0.2481, 0.6988] |
1/15 (0.0667) [0.0119, 0.2982] |
Held-Out Mode Caveat: partial_section fabricates only roster_ages with age heaping (U[0.5, 0.8] to multiples of 5). Scoring v3 detected 11 of 15 fabricators (73.3% recall vs 6.7% for rules). Feature attribution: F8 (age heaping) appeared in 10/11 detections, and F7 (GPS dispersion) appeared in 1/11. While detection succeeded, real-world partial fabricators may fabricate non-numeric sections or adopt heaping patterns that do not align with multiples of 5.
Full table
| Workload Profile |
Total Slots |
Scoring v3 (x/Total) |
No-Shrinkage (x/Total) |
Rules Baseline (x/Total) |
v3 − No-Shrink (Paired 95% CI) |
| Low [5, 15] |
1920 |
1037/1920 (0.5401) |
1139/1920 (0.5932) |
1198/1920 (0.6240) |
-0.0531 [-0.0708, -0.0359] |
| Mixed [5, 60] |
1920 |
196/1920 (0.1021) |
66/1920 (0.0344) |
53/1920 (0.0276) |
+0.0677 [+0.0552, +0.0807] |
| High [40, 60] |
1920 |
0/1920 (0.0000) |
0/1920 (0.0000) |
0/1920 (0.0000) |
+0.0000 [+0.0000, +0.0000] |
| Overall (72 Configs) |
5760 |
1233/5760 (0.2141) |
1205/5760 (0.2092) |
1251/5760 (0.2172) |
+0.0049 [-0.0026, +0.0127] |
| Mode |
Day 2 |
Day 4 |
Day 6 |
Day 8 |
Day 10 |
| copy_paste |
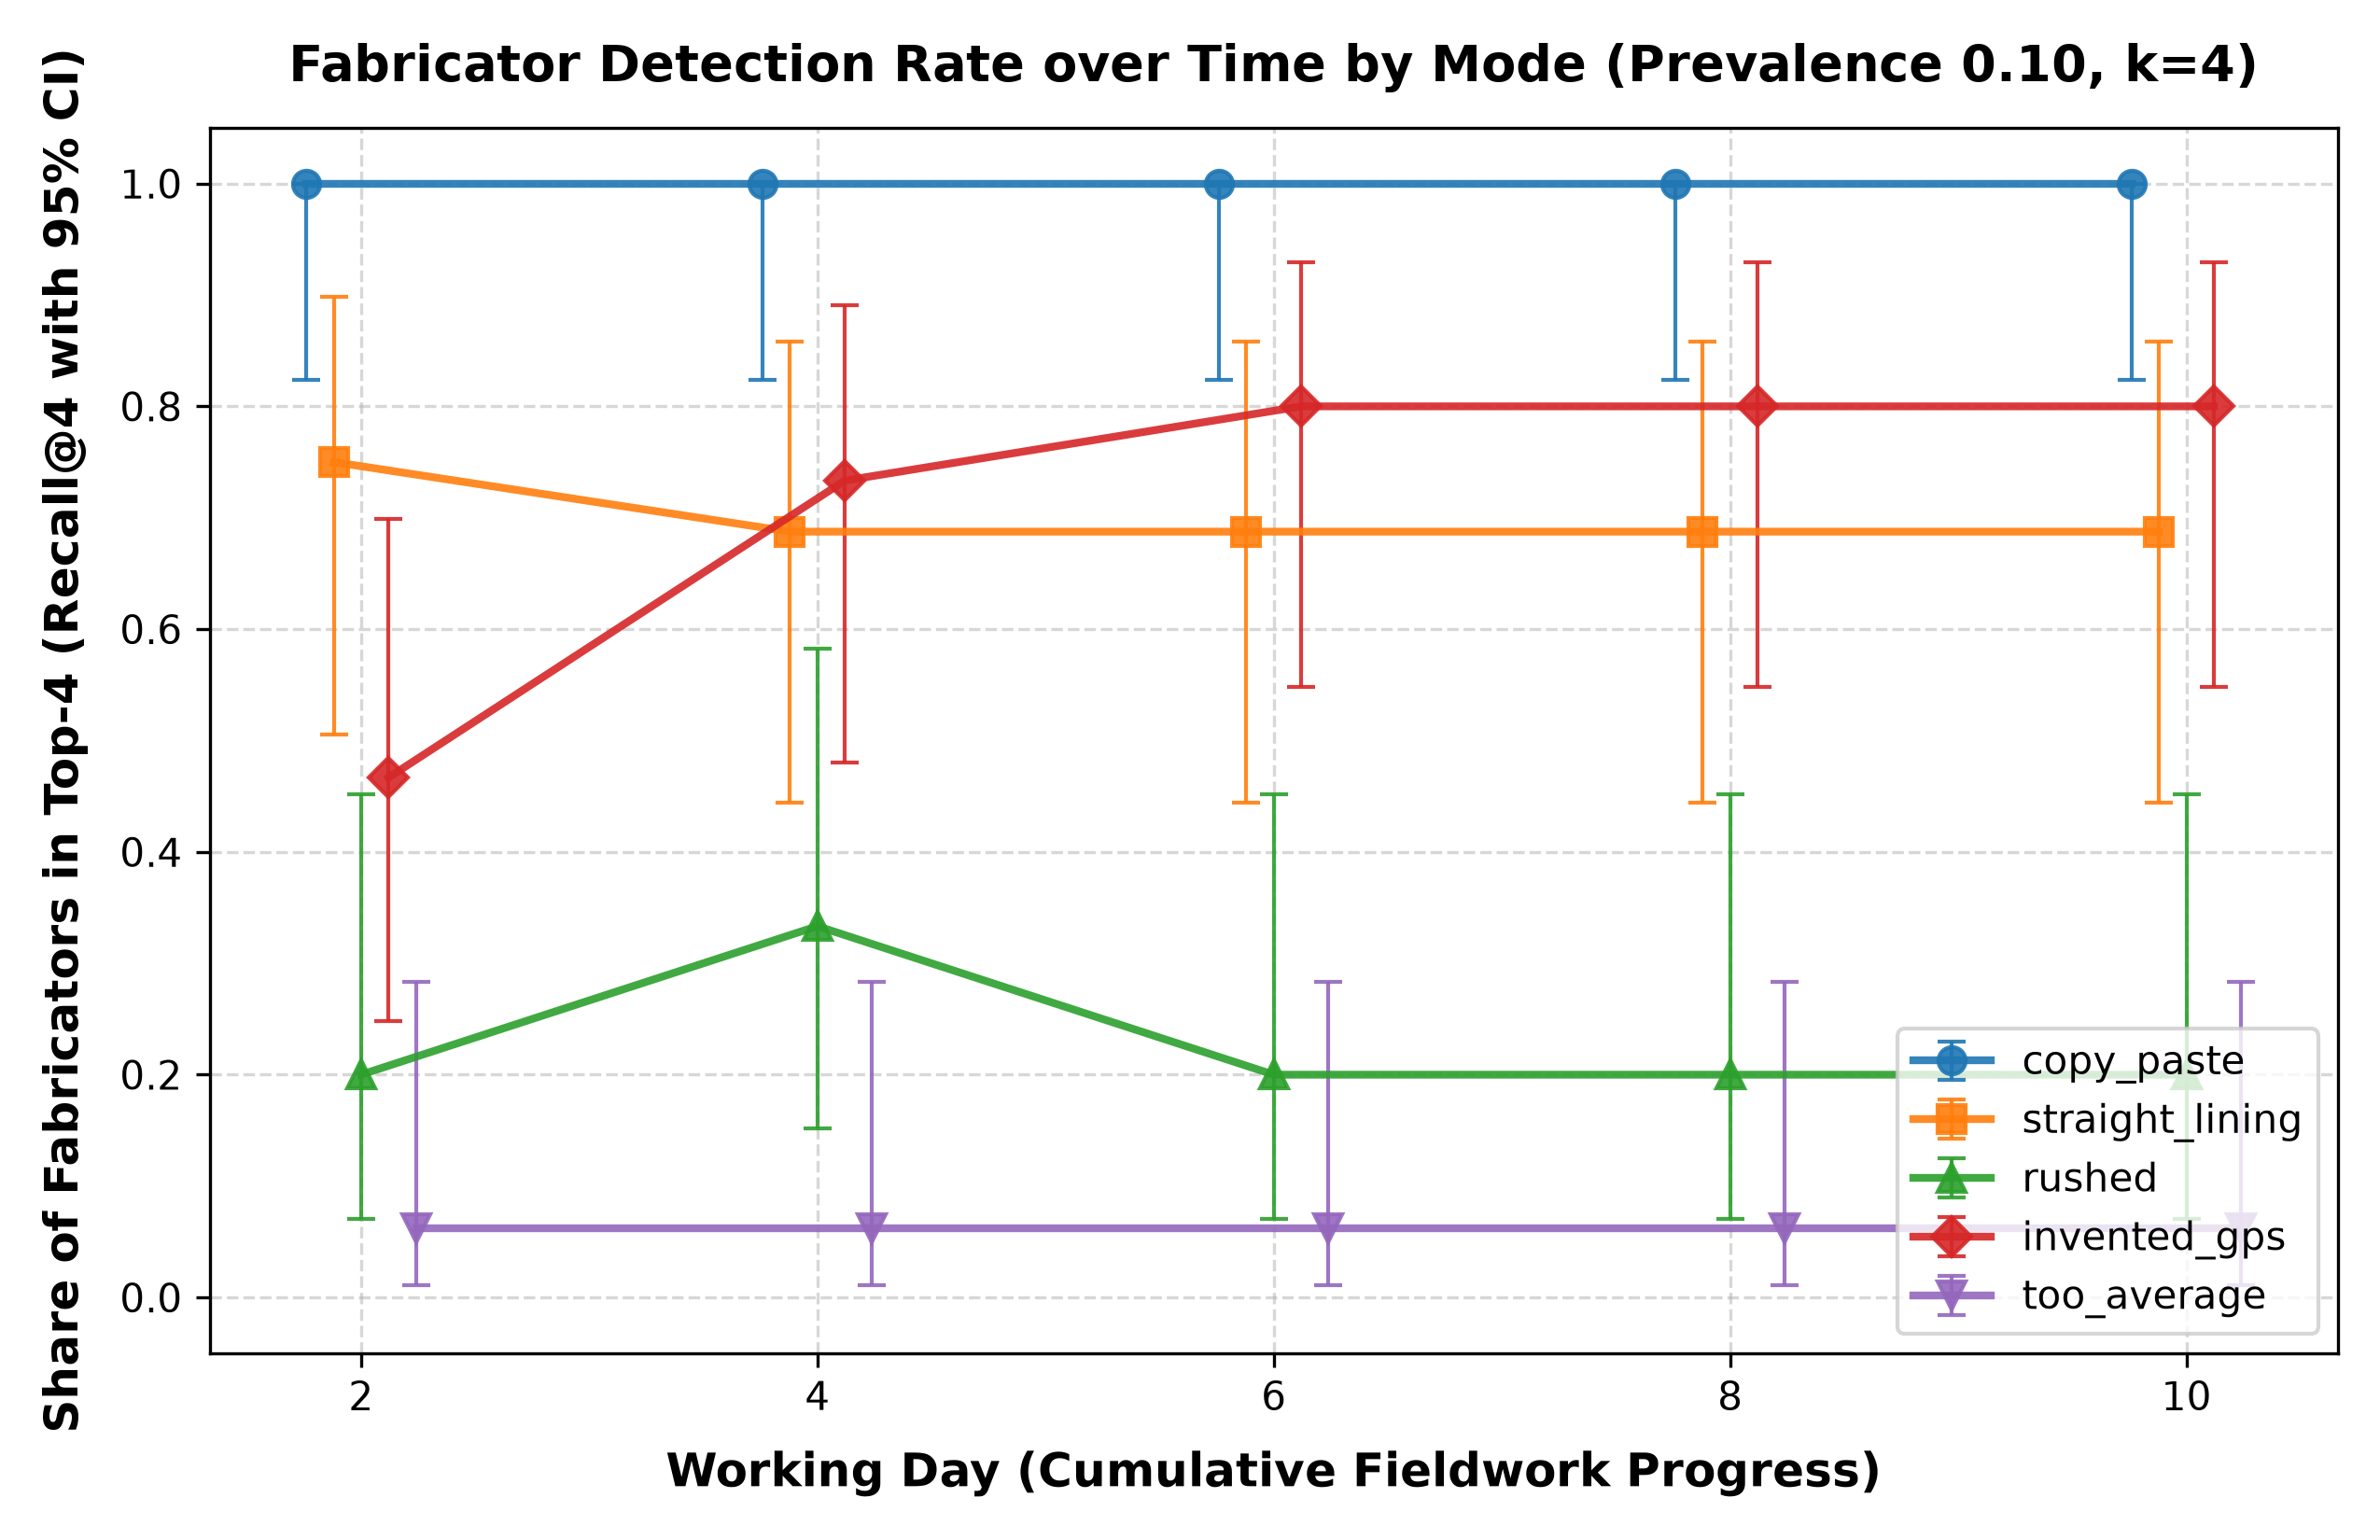
18/18 [0.824, 1.000] |
18/18 [0.824, 1.000] |
18/18 [0.824, 1.000] |
18/18 [0.824, 1.000] |
18/18 [0.824, 1.000] |
| straight_lining |
12/16 [0.505, 0.898] |
11/16 [0.444, 0.858] |
11/16 [0.444, 0.858] |
11/16 [0.444, 0.858] |
11/16 [0.444, 0.858] |
| rushed |
3/15 [0.070, 0.452] |
5/15 [0.152, 0.583] |
3/15 [0.070, 0.452] |
3/15 [0.070, 0.452] |
3/15 [0.070, 0.452] |
| invented_gps |
7/15 [0.248, 0.699] |
11/15 [0.480, 0.891] |
12/15 [0.548, 0.930] |
12/15 [0.548, 0.930] |
12/15 [0.548, 0.930] |
| too_average |
1/16 [0.011, 0.283] |
1/16 [0.011, 0.283] |
1/16 [0.011, 0.283] |
1/16 [0.011, 0.283] |
1/16 [0.011, 0.283] |
- Figure 1: Small-workload honest false-flag counts:
- Figure 2: Fabricator detection rate over time (Wilson 95% CIs):
- Benjamini–Hochberg FDR Control at q = 0.10: Under pure honest null testing, between-enumerator heterogeneity and count dispersion generated false flags in 20 of 20 rounds.
- Trimming and DSL Fallbacks (Amendment 1): Winsorization and degrees-of-freedom adjustments failed to contain false-discovery inflation under severe cell-level variance.
- Empirical-Null and Beta-Binomial Modeling (Amendment 2): Count features still over-flagged rare events because cell peer expectations lacked shrinkage.
- Calibrated Binary Thresholding: Formally abandoned under the pre-specified stopping rule in favor of continuous risk ranking paired with a fixed back-check budget.
- Non-adaptive fraud. Simulated fabricators follow fixed rules. Real fabricators learn which checks exist and avoid them, so detection rates here are likely an upper bound.
- Self-designed evaluation. The same author designs the fraud and the detectors. The held-out mode (§5) reduces this risk but does not remove it.
- Calibration covers marginals only. Target rates are national or rural averages. Regional variation, and correlations beyond the shared wealth factor, are not calibrated.
- Assumed paradata. Duration, timing and GPS-error parameters have no public calibration source. Real paradata includes device clock errors, offline syncing and GPS dropouts that are not modelled.
- Secondary data sources. The asset rates in §3.2 come from secondary reports of the BBS ICT survey and must be checked against the primary publication before release.
- Single primary mode per fabricator. Real fabricators may mix strategies. Mixed-mode fraud is a planned extension.
- Modal knowledge in too_average. too_average fabricators use the exact village modal values from the full frame; real fabricators know local norms only approximately, so this mode may be easier to detect than its real-world counterpart.
- F3 treats roster_ages as one field; honest households with common sizes and asset profiles can match as near-duplicates.
- Calibrated FDR control was not achieved (Scoring v1–v3); the delivered method is risk ranking with a fixed back-check budget.
- Scoring v1 (Pre-registered): Planned Benjamini–Hochberg FDR control at q = 0.10. Under honest null testing (seeds 0..19), 20 of 20 rounds yielded false flags due to between-enumerator heterogeneity and count dispersion. Amendment 1 (trimming, DSL) and Amendment 2 (MAD-based tau^2, beta-binomial B = 200, empirical-null fallback) both failed honest acceptance.
- Scoring v2 (Post-hoc Track): Shifted primary deliverable from binary hypothesis tests to risk ranking (precision@k, recall@k for k = 10%). Evaluated on held-out seeds 100..119 (honest) and 200..219 (fraud). Fixed F3 within-cell pairing and Student-t degrees of freedom, but count features still over-flagged rare events due to un-shrunk cell peer expectations.
- Scoring v3 (Post-hoc, Final & Frozen): Introduced Bayesian shrinkage on cell-level peer rates toward survey-wide averages with M = 50 pseudo-trials prior to seeing evaluation outcomes. Evaluated on strictly fresh seeds 300..319 (honest) and 400..419 (fraud). Calibrated FDR control was permanently abandoned under the pre-specified stopping rule, and the engine was permanently frozen. The delivered system operates strictly as risk ranking paired with field back-check allocation.